Color and Power Doppler US for Diagnosing Carpal Tunnel Syndrome and Determining Its Severity: A Quantitative Image Processing Method
© RSNA, 2011
Appendix E1
Background and Logic of the Program
CTS is one of the most common causes of peripheral neuropathy, and there have been many attempts to develop a noninvasive method for its accurate diagnosis (35). Entrapment of the median nerve within the carpal tunnel affects the microvasculature within the neural fascicles (9,10,36). It is reported that in CTS the intraneural microvasculature of the median nerve is prominent and dilated due to inflammation and ischemia within the median nerve (11). Therefore, we hypothesized that evaluation of intraneural vasculature with color Doppler US may be useful for the detection of CTS. During our pilot evaluation of patients with CTS with color Doppler US, we observed that most patients had a detectable intraneural vascularity and that the degree of vascularity had a positive correlation with the severity of symptoms in patients with CTS. Intraneural vascularity was often not evident in healthy individuals. We supposed that, by determining the number of pixels in blood flow areas on the recorded images from power Doppler US, we may be able to estimate the quantity of intraneural blood vascularity. Therefore, we designed an image processing program with which to determine the number of pixels in blood flow areas on the recorded US images and evaluated the relationship between these pixel numbers and the severity of CTS in a well-balanced study. We should note that there are limited data available regarding the evaluation of intraneural vascularity with color Doppler US. This is a relatively uncharacterized area of research and, unfortunately, more limited evidence is available for evaluation of the median nerve (16). We believe that our method of color pixel quantification may have other applications beyond its current use as a pixel counter for the quantification of vascularity within the region of the median nerve. Therefore, we would like to provide this program as a supplement to our article for possible use in future studies.
Function of the Program
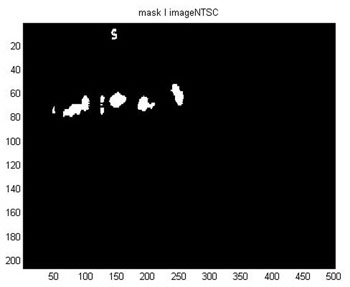
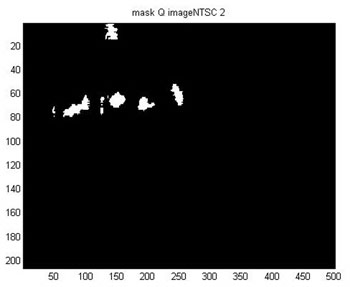
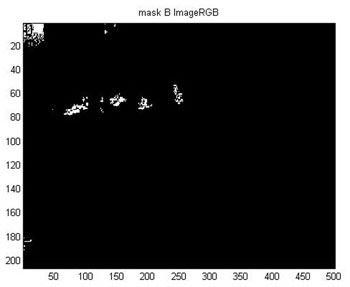
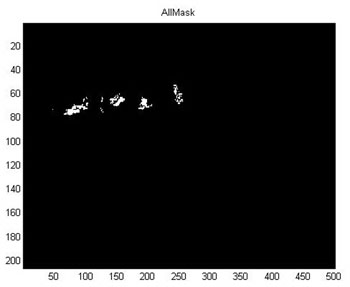
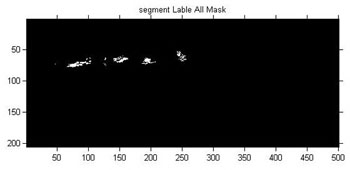
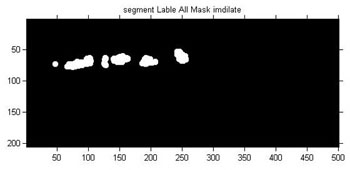
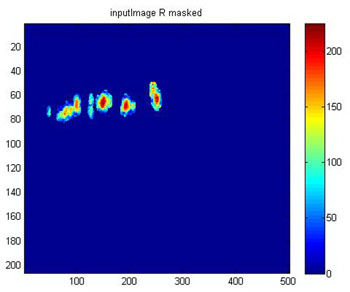
The image processing program was written with use of MATLAB software. The input of the program is the power Doppler images that are recorded directly by the US unit. The recorded images must be transferred from the US unit to a general-purpose personal computer for image processing. The guide to the use of the program and a processed sample are provided in the following sections. In simple wording, this program counts the number of pixels in the red areas of intraneural blood flow. At first, this program determines the red-green-blue combination on the images. Then, using the optimal thresholds of 0 and 0.05, respectively, for the luminance and chrominance of the image pixels in each individual red, green, or blue component, it transforms the colored pixels to white and the remaining parts to black. After intersecting the three components, it produces a mask determining the area of interest (colored pixels of the original image). Then, the program applies this mask on the original image and calculates the number of pixels in the colored areas (the sequential output of automatic processing of a sample image by this program is provided in A Sample Output of Image Processing).
Guide To Use of the Program
Prerequisites
Verify that MATLAB Compiler Runtime is installed on your personal computer and ensure that you have installed version 7.10.
The MATLAB Compiler uses MATLAB Compiler Runtime, which is a stand-alone set of shared libraries that provides complete support for all features of MATLAB without the MATLAB graphical user interface.
MCRInstaller.exe can be accessed via the mathworks.com Web site (http://www.mathworks.com/help/toolbox/compiler/mcrinstaller.html).
Running the Program
Place your input power Doppler image in the main folder of the program and run main.exe. Please note that the input image must be in JPEG format and named "image."
The software program is available for download from the following link: http://dl.dropbox.com/u/35115685/main.rar.
A Sample Output of Image Processing
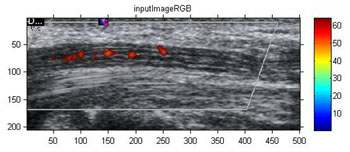
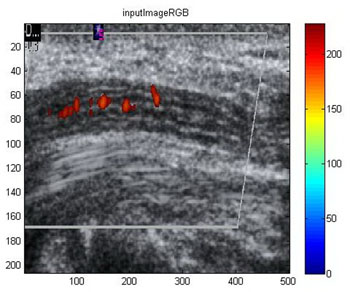
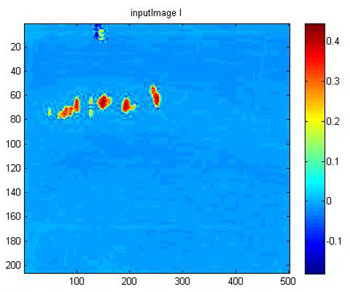
As an example, we would like to process the pixel numbers for Figure E1. The image will be placed under the name "image" in the main folder of the program (Fig E2). Then, the program will be run by clicking on the executable file, main.exe. The program will automatically analyze the input image, sequentially provide the in-process images to the final image, and calculate the number of pixels. The sequential output of the program (for Fig E1) is provided in Figure E3.
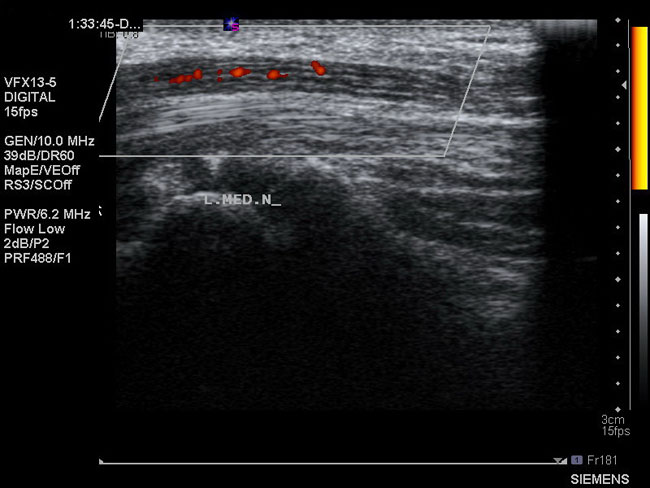
Figure E1: Input image.
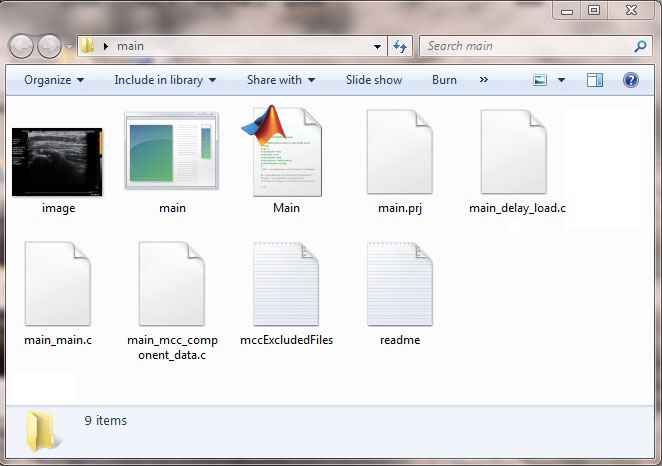
Figure E2: Guide to run the program. The program will be run by clicking on the executable file, main.exe.
 a. |
 b. |
 c. |
 d. |
 e. |
 f. |
 g. |
 h. |
 i. |
 j. |
 k. |
 l. |
 m. |
 n. |
 o. |
 p. |
 q. |
 r. |
 s. |
 t. |
 u. |
 v. |
 w. |
 x. |
 y. |
 z. |
 za. |
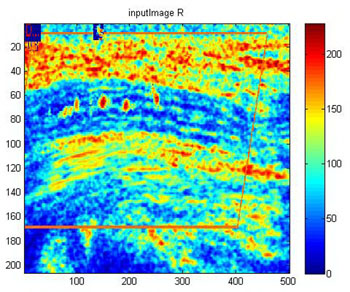
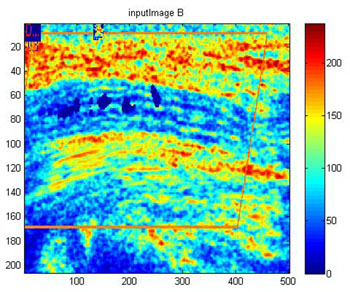
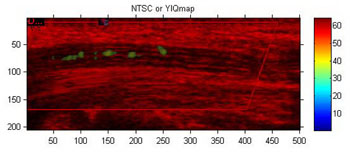
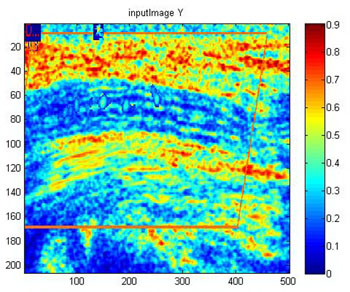
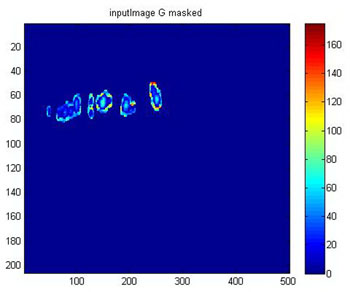
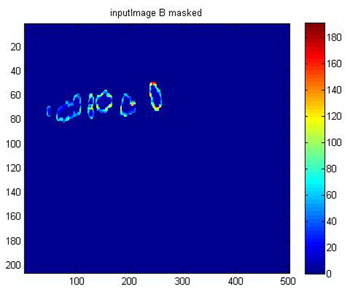
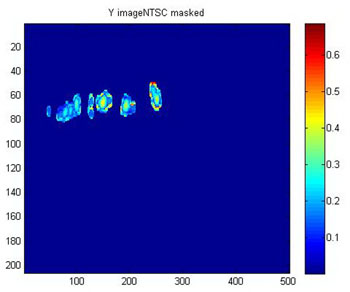
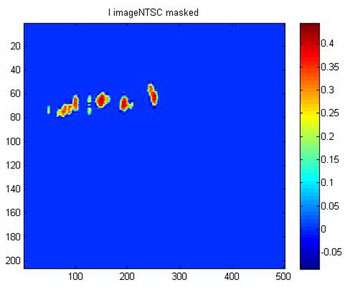
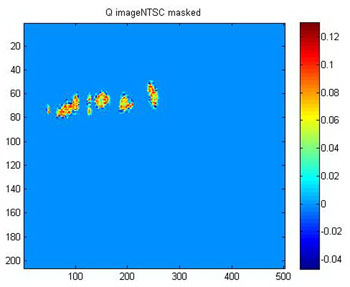
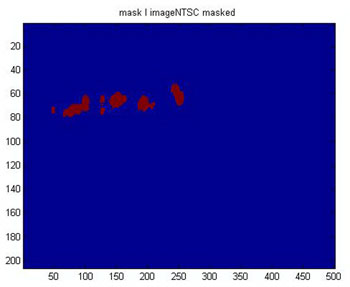
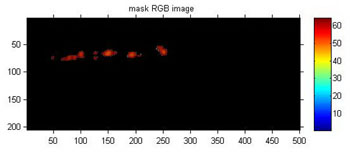
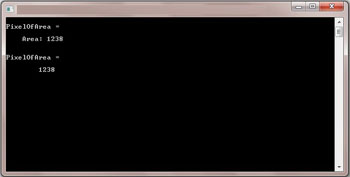
Figure E3: (a-y) Consecutive outputs of the image processing program. (z) Final processed image. (za) Pixel numbers output. Note: the National Television Systems Committee (NTSC) defines a color space known as YIQ. In the NTSC color space, image data consist of three components: luminance (Y), hue (I), and saturation (Q). B = blue, G = green, R = red.
References
35. Werner RA, Andary M. Carpal tunnel syndrome: pathophysiology and clinical neurophysiology. Clin Neurophysiol 2002;113(9):1373-1381.doi:10.1016/S1388-2457(02)00169-4 PubMed
Supplemental Material
-
Radiology November 2011 vol. 261 no. 2 499-506
- Abstract
- Figures Only
- Full Text
- Full Text (PDF)
- » Appendix E1
Current Issue

-
Read
- Guidelines for Management of Small Pulmonary Nodules Detected on CT Scans: A Statement from the Fleischner Society
- Normal adnexa uteri specimens: anatomic basis of MR imaging features
- Advances in Imaging of Osteoarthritis and Cartilage
- Management of Asymptomatic Ovarian and Other Adnexal Cysts Imaged at US: Society of Radiologists in Ultrasound Consensus Conference Statement
- Intracranial Cysts: Radiologic-Pathologic Correlation and Imaging Approach
-
Cited
- The meaning and use of the area under a receiver operating characteristic (ROC) curve
- A method of comparing the areas under receiver operating characteristic curves derived from the same cases
- Diffusion tensor MR imaging of the human brain
- An Improved MR Imaging Technique for the Visualization of Myocardial Infarction
- MR imaging of intravoxel incoherent motions: application to diffusion and perfusion in neurologic disorders